IR
To our Shareholders and Investors
IR LIBRARY
- January 14, 2026 FY2026 1Q Financial Results Briefing【Video】
- January 14, 2026Results of Operations for the First Quarter of the Fiscal Year Ended August 31, 2026
- January 14, 2026Summary of Consolidated Financial Results for the First Quarter of the Fiscal Year Ending August 31, 2026
- August 31, 2025FY2025 Q4 Financial Results Briefing [Overview]【Video】
- August 31, 2025FY2025 Q4 Financial Results Briefing [Growth Strategy]【Video】
- August 31, 2025Results of Operations for the Fiscal Year Ended August 31, 2025
- August 31, 2025Summary of Consolidated Financial Results for the Fiscal Year Ended August 31, 2025
- August 31, 2025Results of Operations for the Third Quarter of the Fiscal Year Ended August 31, 2025 【Video】
- August 31, 2025Results of Operations for the Third Quarter of the Fiscal Year Ended August 31, 2025
- August 31, 2025Summary of Consolidated Financial Results for the Third Quarter of the Fiscal Year Ending August 31, 2025
- April 14, 2025Results of Operations for the First Half of the Fiscal Year Ended August 31, 2025
- April 14, 2025Summary of Consolidated Financial Results for the Second Quarter of the Fiscal Year Ending August 31, 2025
- January 14, 2025Results of Operations for the First Quarter of the Fiscal Year Ended August 31, 2025
- January 14, 2025Summary of Consolidated Financial Results for the First Quarter of the Fiscal Year Ending August 31, 2025
- August 31, 2024Results of Operations for the Fiscal Year Ended August 31, 2024
- August 31, 2024Summary of Consolidated Financial Results for the Fiscal Year Ended August 31, 2024
- July 12, 2024Results of Operations for the Third Quarter of the Fiscal Year Ended August 31, 2024
- July 12, 2024Summary of Consolidated Financial Results for the Third Quarter of the Fiscal Year Ending August 31, 2024
- April 26, 2024Results of Operations for the First Half of the Fiscal Year Ended August 31, 2024
- April 12, 2024Summary of Consolidated Financial Results for the Second Quarter of the Fiscal Year Ending August 31, 2024
- January 23, 2024Results of Operations for the First Quarter of the Fiscal Year Ended August 31, 2024
- January 12, 2024Summary of Consolidated Financial Results for the First Quarter of the Fiscal Year Ending August 31, 2024
- October 26, 2023Results of Operations for the Fiscal Year Ended August 31, 2023
- October 13, 2023Summary of Consolidated Financial Results for the Fiscal Year Ended August 31, 2023
- July 31, 2023Results of Operations for the Third Quarter of the Fiscal Year Ended August 31, 2023
- July 14, 2023Summary of Consolidated Financial Results for the Third Quarter of the Fiscal Year Ending August 31, 2023
- April 27, 2023Results of Operations for the First Half of the Fiscal Year Ended August 31, 2023
- April 14, 2023Summary of Consolidated Financial Results for the Second Quarter of the Fiscal Year Ending August 31, 2023
- January 30, 2023Results of Operations for the First Quarter of the Fiscal Year Ended August 31, 2023
- January 13, 2023Summary of Consolidated Financial Results for the First Quarter of the Fiscal Year Ending August 31, 2023
- October 31, 2022Results of Operations for the Fiscal Year Ended August 31, 2022
- October 19, 2022Summary of Consolidated Financial Results for the Fiscal Year Ended August 31, 2022
- August 5, 2022Results of Operations for the First Nine Months of the Fiscal Year Ended August 31 2022
- July 14, 2022SERAKU_Summary of Consolidated Financial Results for the Third Quarter of the Fiscal Year Ending August 31, 2022
- May 25, 2022SERAKU's Growth Strategy for Taking on Change
- April 26, 2022Results of Operations for the First Half of the Fiscal Year Ended August 31, 2022
- April 13, 2022SERAKU_Summary of Consolidated Financial Results for the Second Quarter of the Fiscal Year Ending August 31, 2022
- January 28, 2022Results of Operations for the First Quarter of the Fiscal Year Ended August 31, 2022
- January 24, 2022SERAKU_Summary of Consolidated Financial Results for the First Quarter of the Fiscal Year Ended August 31, 2022
- October 15,2021SERAKU_Summary of Consolidated Financial Results for the Fiscal Year Ended August 31, 2021
- August 3, 2021Results of Operations for the Third Quarter of the Fiscal Year Ending August 31, 20211
- July 14, 2021SERAKU_Summary of Consolidated Financial Results for the Third Quarter of the Fiscal Year Ending August 31, 2021
- May 6, 2021Results of Operations for the First Half of the Fiscal Year Ending August 31, 2021
- April 14, 2021Announcement of Dividend Payments Linked to Results of Operations
- April 13, 2021SERAKU_Summary of Consolidated Financial Results for the Second Quarter of the Fiscal Year Ending August 31, 2021
- February 3rd, 2021SERAKU_Summary of Consolidated Financial Results for the First Quarter of the Fiscal Year Ending August 31, 2021
- November 20th, 2020SERAKU_Summary of Consolidated Financial Results for the Fiscal Year Ended August 31, 2020
- November 20th, 2020Results of Operations for the Fiscal Year Ended August 31,2020
FINANCIAL INFORMATION
Five-year Summary
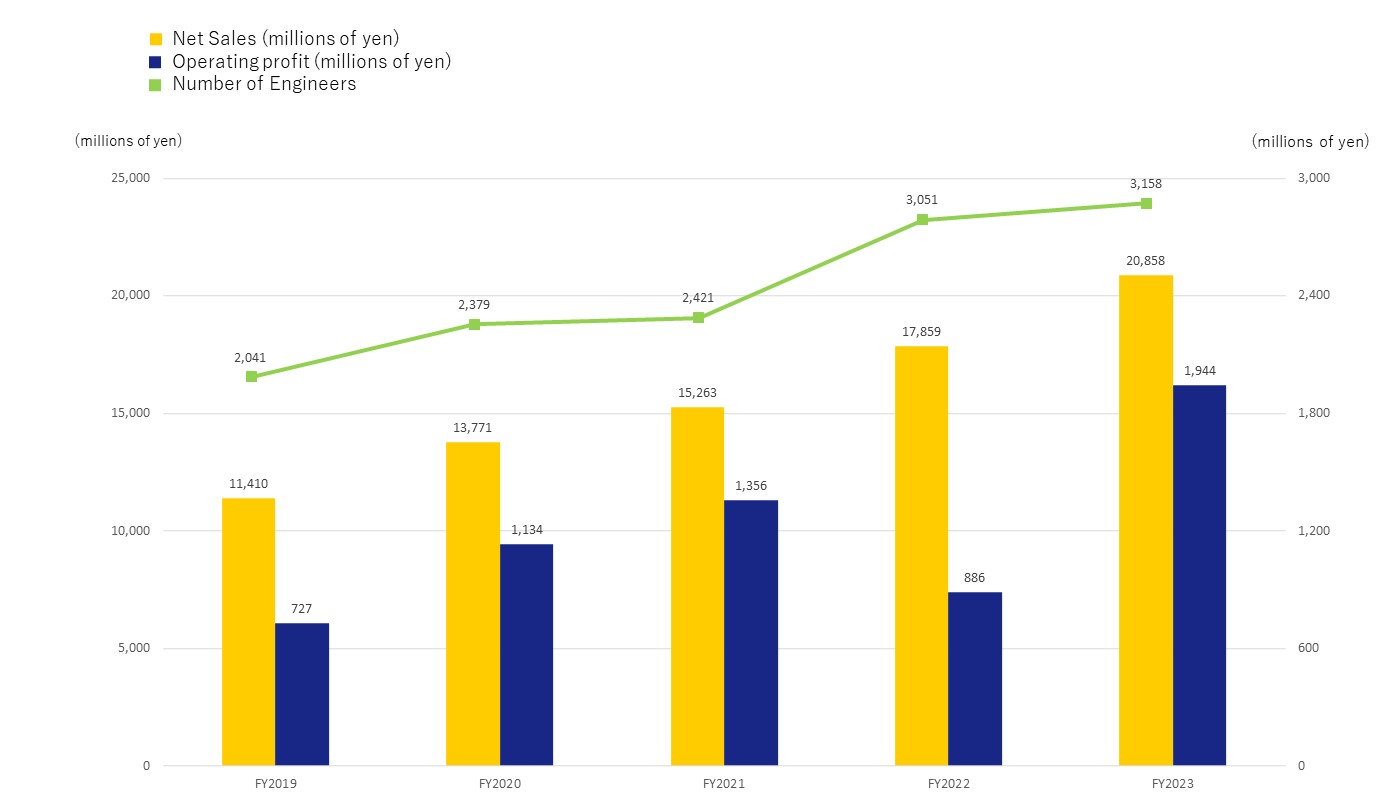
Net sales
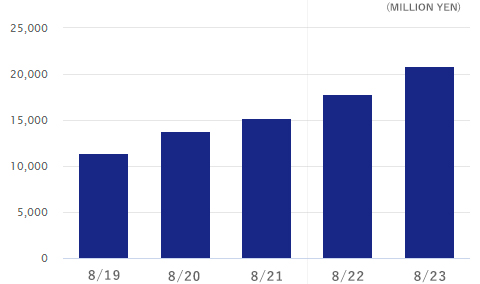
| 8/20 | 8/21 | 8/22 | 8/23 | 8/24 |
|---|---|---|---|---|
| 13,771 | 15,263 | 17,859 | 20,858 | 22,221 |
Ordinary profit
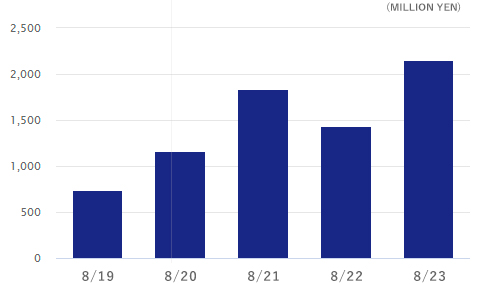
| 8/20 | 8/21 | 8/22 | 8/23 | 8/24 |
|---|---|---|---|---|
| 1,165 | 1,836 | 1,434 | 2,156 | 2,317 |
Profit attributable to owners of parent
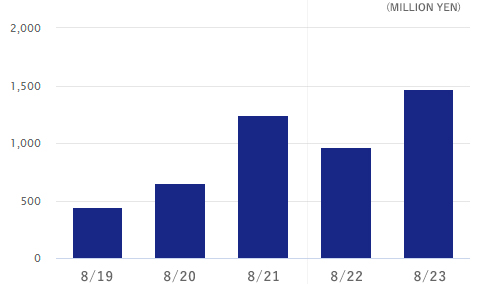
| 8/20 | 8/21 | 8/22 | 8/23 | 8/24 |
|---|---|---|---|---|
| 654 | 1,240 | 966 | 1,472 | 1,575 |
Total assets, Total net assets
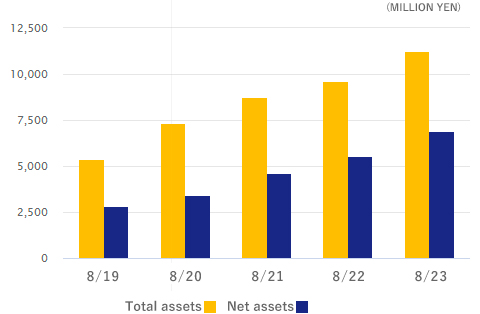
| 8/20 | 8/21 | 8/22 | 8/23 | 8/24 | |
|---|---|---|---|---|---|
| Total assets (MILLION YEN) |
7,342 | 8,730 | 9,620 | 11,253 | 12,052 |
| Total net assets (MILLION YEN) |
3,429 | 4,616 | 5,519 | 6,904 | 7,762 |
Book value per share
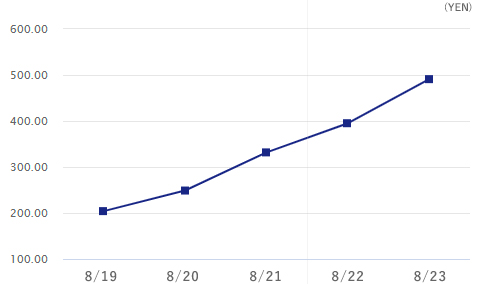
| 8/20 | 8/21 | 8/22 | 8/23 | 8/24 |
|---|---|---|---|---|
| 248.82 | 331.77 | 395.18 | 490.98 | 572.00 |
Earnings per share
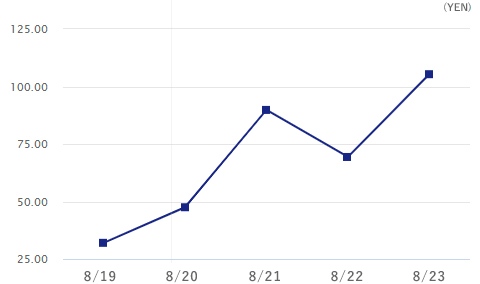
| 8/20 | 8/21 | 8/22 | 8/23 | 8/24 |
|---|---|---|---|---|
| 47.50 | 89.82 | 69.36 | 105.35 | 114.24 |
- * The Company employ concatenated accounting after the fiscal year ending August 2018.
- * The Company conducted a share split at a ratio of twenty-for-one effective August 8, 2014. The Company conducted a share split at a ratio of hundred-for-one effective April 30, 2016. The Company conducted a share split at a ratio of four-for-one effective March 1, 2017. The figures for Consolidated Net Assets per Share, Net income per share are accordingly adjusted assuming.
Please note the following:
- ・This site will not be immediately updated if correction of earnings data and others are announced.
- ・Frequency of updates may vary due to changes in earnings report format.
- The data used within this site is compiled from the earnings announcements.
- In the preparation of the various data shown within this site, we make every effort to ensure its accuracy. But despite our best efforts, the possibility for inaccuracy in the data due to reasons beyond our control exists.
- For more detailed earnings information please see the Reference Material.
- The data contained within this page is provided by PRONEXUS INC.
Financial statements
(milions of yen)
FY8/20
FY8/21
FY8/22
FY8/23
FY8/24
Profit and loss statement
Net sales
13,771
15,263
17,859
20,858
22,221
Cost of sales
10,486
11,596
13,954
15,680
16,521
(Cost of sales ratio)
76.1%
76.%
78.1%
75.2%
74.3%
Gross profit
3,285
3,667
3,904
5,178
5,700
(Gross profit ratio)
23.9%
24.%
21.9%
24.8%
25.7%
SG&A expense
2,150
2,311
3,017
3,233
3,426
(SG&A ratio)
15.6%
15.1%
16.9%
15.5%
15.4%
Operating profit
1,134
1,356
886
1,944
2,273
(Operating profit ratio)
8.2%
8.9%
5.%
9.3%
10.2%
Non-operating income
34
484
550
213
45
Non-operating expenses
3
4
3
2
1
Ordinary profit
1,165
1,836
1,434
2,156
2,317
(Ordinary profit ratio)
8.5%
12.%
8.%
10.3%
10.4%
Extraordinary income
0
0
0
0
6
Extraordinary losses
102
16
11
9
6
Profit before income taxes
1,063
1,820
1,423
2,147
2,317
Total income taxes
409
579
456
674
741
(Effective income tax rate)
38.5%
31.8%
32.1%
31.4%
32.0%
Profit attributable to owners of parent
654
1,240
966
1,472
1,575
(Net profit ratio)
4.7%
8.1%
5.4%
7.1%
7.1%
Current assets
6,315
7,496
8,260
9,725
10,085
Cash and deposits
4,329
5,458
5,658
6,867
6,896
Notes and accounts receivable
1,826
1,821
2,336
2,562
2,740
Inventories
56
95
86
95
266
Others
103
121
178
201
181
Non-current assets
1,026
1,234
1,360
1,527
1,966
Property,plant and equipment
134
199
207
222
384
Intangible assets
35
22
9
2
127
Investments other assets
856
1,012
1,143
1,302
1.454
Total assets
7,342
8,730
9,620
11,253
12,052
Current liabilities
2,773
3,235
3,828
4,178
4,124
Notes and accounts payable-trade
57
111
159
130
262
Short-term borrowings
106
255
600
183
0
Others
2,609
2,868
3,069
3,865
3,861
Non-current liabilities
1,139
879
272
170
165
Total Liabilities
3,912
4,114
4,101
4,349
4,289
Total shareholders' equity
3,421
4,611
5,510
6,864
7,729
Share capital
297
304
306
307
311
Capital surplus
495
501
503
504
309
Retained earnings
2,628
3,805
4,700
6,052
7,482
Treasury shares
0
0
0
0
-374
Own equity
3,425
4,611
5,510
6,864
7,731
Total net assets
3,429
4,616
5,519
6,904
7,762
Total liabilities and net assets
7,342
8,730
9,620
11,253
12,052
EPS (\)
47.5
89.8
69.3
105.4
114.2
BPS (\)
248.8
331.7
395.1
491.0
572.0
Cash flows from operating activities
995
1,467
704
2,027
1,357
Cash flows from investing activities
-160
-186
-176
-195
-404
Free cash flows
835
1,281
527
1,832
953
Cash flows from financing activities
724
-154
-328
-625
-923
Cash and cash equivalents at end of period
4,282
5,409
5,608
6,814
6,844
- * The Company conducted a share split at a ratio of four-for-one effective March 1, 2017. The figures for Consolidated Net Assets per Share, Net income per share are accordingly adjusted assuming.